


Ecological Footprint Services
Ecological Footprint Services
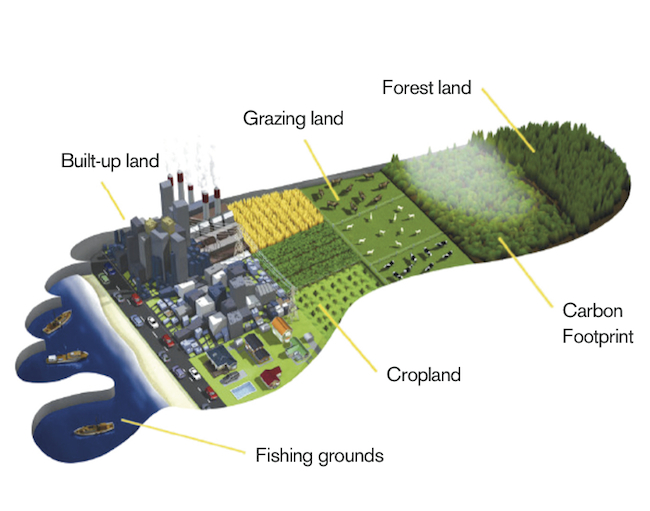
Ecological Footprint accounting measures the demand on and supply of nature. On the demand side, the Ecological Footprint measures the ecological assets that a given population requires to produce the natural resources it consumes (including plant-based food and fibber products, livestock and fish products, timber and other forest products, space for urban infrastructure) and to absorb its waste, especially carbon emissions.
Per capita ecological footprint is a means of comparing consumption and lifestyles, and checking this against nature's ability to provide for this consumption. The tool can inform policy by examining to what extent a nation uses more (or less) than is available within its territory or to what extent a nation's lifestyle would be replicable worldwide. The footprint can also be a useful tool to educate people about carrying capacity and over-consumption, with the aim of altering personal behaviour. Ecological footprints may be used to argue that many current lifestyles are not sustainable. Such a global comparison also clearly shows the inequalities of resource use on this planet at the beginning of the twenty-first century. The Ecological Footprint tracks the use of six categories of productive surface areas: cropland, grazing land, fishing grounds, built-up land, forest area, and carbon demand on land.
On the supply side, a city, state or nation's bio-capacity represents the productivity of its ecological assets (including cropland, grazing land, forest land, fishing grounds, and built-up land). These areas, especially if left unharvested, can also absorb much of the waste we generate, especially our carbon emissions.
Ecological footprint measures how human affect on our planet. In order to solve the global environmental problems,
it is crucial to figure out who is the determinism. If a population's Ecological Footprint exceeds the region's bio-capacity,
that region runs an ecological deficit. Its demand for the goods and services that its land and seas can provide fruits and
vegetables, meat, fish, wood, cotton for clothing, and carbon dioxide absorption exceeds what the region's ecosystems can renew.
A region in ecological deficit meets demand by importing, liquidating its own ecological assets (such as overfishing), and/or
emitting carbon dioxide into the atmosphere. If a region's bio-capacity exceeds its Ecological Footprint, it has an ecological reserve.
The Ecological Footprint can be calculated for a single individual, city, region, country and even the entire planet.
The gap between Ecological Footprint and bio-capacity is determined by several factors. Our personal Footprint is the product of how much we use and how efficiently this is being produced. The bio-capacity per person is determined by how many hectares of productive area there is, how productive each hectare is, and how many people (in a city, country, or the world) share this bio-capacity.
Many countries are "in the red," which means they use more natural resources (Ecological Footprint),
than their ecosystems can regenerate (Bio-capacity). They are running an "ecological deficit".
When a country's bio-capacity is greater than its population's Ecological Footprint, the country has an "ecological reserve".
Nations (also cities and states) can run ecological deficits by liquidating their own resources, such as by overfishing; importing resources from other areas; and/or emitting more carbon dioxide into the atmosphere than their own ecosystems can absorb.
Earth Overshoot Day
When the entire planet is running an ecological deficit, we call it "overshoot". At the global level, ecological deficit and overshoot are the same, since there is no net import of resources to the planet. Overshoot occurs when:
HUMANITY'S ECOLOGICAL FOOTPRINT > EARTH'S BIOCAPACITY
Earth Overshoot Day marks the date when humanity's demand for ecological resources and services (Ecological Footprint) in a given year exceeds, what Earth can regenerate in that year (bio-capacity).
The Data
Your country has offices that collect data about the country's economic activities, agricultural productivity, imports and exports, energy consumption, etc. These data allow us to calculate how much food (apples, pasta, orange juice) has been eaten, how much wood used to make furniture, how much energy households use and so on. These offices report the data to international agencies, including the United Nations, which distribute this information in consistent formats for most countries in the world. Global Footprint Network, which calculates the Ecological Footprint for more than 200 countries, gets the data from these international offices and applies them to its comprehensive accounting database to calculate how many resources each country consumes.
We can help reverse the damage by reducing our own Eco Footprint. This is the challenge we are facing. The goal is for all humans to live a fulfilling life without degrading our planet's resources. Organizations, countries and individuals are waking up and doing their share to ensure that our planet can cope with our ever growing demands.
The Way Forward
Help save our planet. One person with an initiative can influence another person and soon, we will have a planet that's concerned with its Ecological Footprint. Small step can make big difference. Here's how you can contribute
- Save Electricity
- Save Water
- Buy Organic and Local Products
- Bring your own Shopping Bag
- Recycle plastic, cardboard, paper and glass
- Practice Family Planning
- Choose Energy Efficient Appliances and Electronics
- Buy products that are biodegradable and environment friendly
- Reuse materials. Don't just throw them away
- Don't buy anything that involves animals that are in danger of extinction
Reducing your Carbon Footprint
- Use a cleaner mode of transport.
- Walk, ride a bike or use public transport when you can.
- Have your vehicle tested regularly to reduce emissions
- Properly insulate your home to reduce energy consumption.
- Turn off your lights and appliances when not in use.
- Buy energy efficient appliances.
Reducing your Food Footprint
- Buy Local and organic foods. Support our local farmers.
- Buy food from local stores. These foods did not travel a long way to reach you and did not consume too many resources. And they're fresher!
- Choose foods with minimal packaging.
- Support foods that are processed and manufactured with the environment in mind.
This is to encourage food manufacturers who are trying to do the right thing.
- Eat less meat. 18% of greenhouse gases are from Meat Production.
Reducing your Home's Footprint
- Install catch water systems to catch rainwater which can water your plants or lawn.
- Don't let the faucet over run.
- Avoid Power-Washing. This wastes too much water!
- Recycle all your used Plastics, Electronics, Paper, Glass and Aluminium.
World Footprint
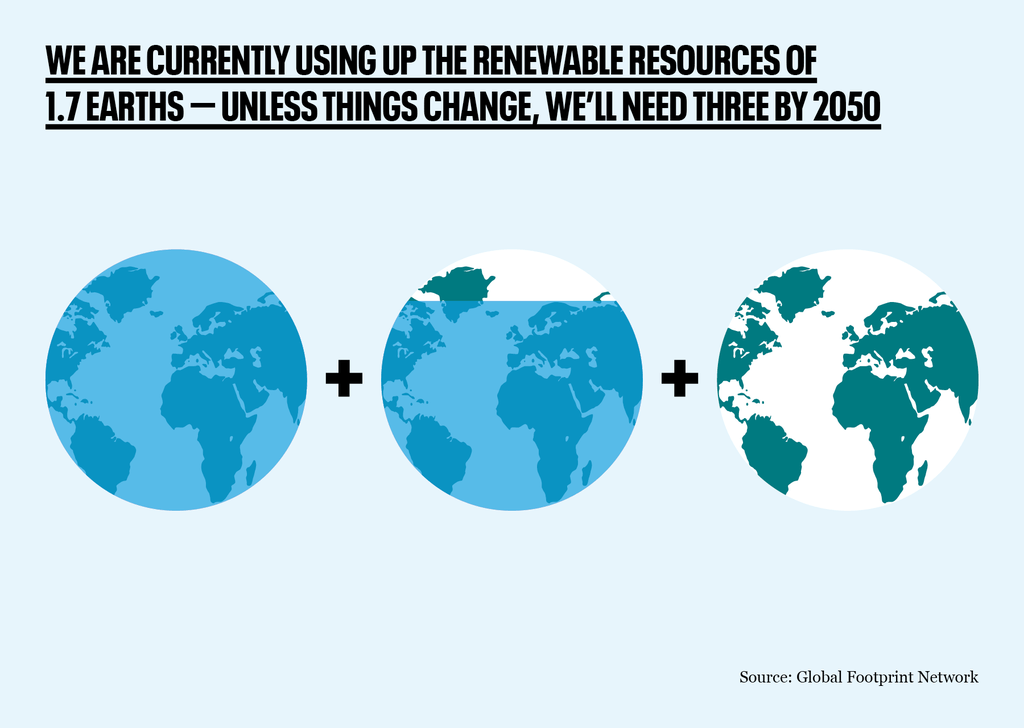
Today humanity uses the equivalent of 1.75 Earths to provide the resources we use and absorb our waste. This means it now takes the Earth one year and eight months to regenerate what we use in a year.
Our Ecological Footprint
Today, our global footprint is in overshoot. It would take 1.5 Earths to sustain our current population. If current trends continue, we will reach 3 Earths by the year 2050.
HOW MANY PEOPLE CAN OUR WORLD SUPPORT ?
No species has altered the Earth's natural landscape the way humans have. Our impact is so extensive that we are crossing into a new geologic epoch - the Anthropocene - propelled by human behavior. Global climate change, mass extinction, and overexploitation of our global commons are all examples of the ways in which humans have altered the natural landscape. Our growing population, coupled with rising affluence and per capita impact, is driving our planet closer to its tipping point. With population expected to reach 9.5 billion by 2050, many wonder if our natural resources can keep up with our growing demands.
The World Population Map can be viewed with the data overlay, "Anthropogenic Transformation," created by ecologist Erle Ellis. Instead of dividing the world into classical biomes (savanna, rainforest, woodlands, tundra, etc.), Ellis conceived of depicting a map of "anthromes" to describe the way human have reshaped the earth's ecological patterns. The Anthrome map shows croplands, rangelands, urban areas and other human settlements.
UNDERSTANDING CARRYING CAPACITY
Human population, now over 7 billion, cannot continue to grow indefinitely. There are limits to the life-sustaining resources earth can provide us. In other words, there is a carrying capacity for human life on our planet. Carrying capacity is the maximum number of a species an environment can support indefinitely. Every species has a carrying capacity, even humans. However, it is very difficult for ecologists to calculate human carrying capacity. Humans are a complex species. We do not reproduce, consume resources, and interact with our living environment uniformly. Carrying capacity estimates involve making predictions about future trends in demography, resource availability, technological advances and economic development.
OUR ECOLOGICAL FOOTPRINT
One way to address the challenges associated with making future projections is to look at current human impact on the planet. The ecological footprint is a measurement of the anthropogenic impact on earth. It tracks how much biocapacity (biological capacity) there is and how much biocapacity people use by comparing the rate at which we consume natural resources and generate waste to the planet's ability to replenish those resources and absorb waste. Today, our global footprint is in overshoot. It would take 1.5 Earths to sustain our current population. If current trends continue, we will reach 3 Earths by the year 2050.
WHERE DO WE GROW FROM HERE ?
Our planet does not have the biocapacity to sustain our current levels of growth and resource consumption. So, what can be done to minimize our collective impact on the environment? In his book, How Many People Can the Earth Support?, mathematical biologist Joel Cohen classifies current solutions into three paradigms: those looking for a "bigger pie" (improving technology), those advocating for "fewer forks" (slowing population growth), and those looking to rationalize and improve decision-making though "better manners" (changing global culture). Cohen argues that, standing along, each paradigm is necessary in solving our environmental crisis, but not sufficient. Change must come from a combination of all three. "Promoting access to contraceptives, developing economies, saving children, empowering women, educating men, and doing it all at once," he writes, is a way to both lower our impact on the planet and improve the quality of life for all. Perhaps Oxford economist Robert Cassen said it best, "Virtually everything that needs doing from a population perspective needs doing anyway". Adopting human-centered initiatives targeted at addressing both population growth and consumption habits, ranging from the individual to trans-national level, are our best hope for achieving a sustainable future.
PROJECTING GLOBAL POPULATION TO 2050 AND BEYOND
Numbers help tell stories. But numbers can also BE the story. The world's population exists in numbers - billions of numbers. In 2011, when human population surpassed seven billion that was the story, not just for the size of the number but for the short amount of time it took to get to that point. Just a hundred years ago the world's population had yet to reach two billion, less than a third of the number on earth today. Now, as our global family grows from 7.3 billion, adding 80 million people each year, where are we headed? If and when will our world population stop growing ?
CALCULATING HUMAN POPULATION GROWTH
Just like a historian assists in making sense of the past through the interpretation of records and events, a demographer acts in a similar capacity to make sense of human populations, both their present trends and future projections. And like historians, demographers use the best information available, beginning with a census. Most countries conduct a census - a count of the populace - every decade. In addition to census data, demographers consider fertility and life expectancy when making projections.
Fertility rate, the primary variable in making population projections, is defined as the number of children a woman will bear during her reproductive years (age 15-44). In order for a country to maintain the size of its current population, it must reach a fertility rate of 2.1 or what is called replacement level fertility. With a fertility rate of 2.1, a population is considered stable, which is a way of saying that the next generation of children born will equally replace the generation of adults who have passed. With our current global fertility rate at 2.5, our population increases. While the difference between a fertility rates of 2.1 and 2.5 may seem small, this difference propels our population growth by approximately 80 million additional people each year - the equivalent of adding the population of Germany.
Most demographers expect this growth to continue through the rest of this century before global population levels off. On the World Population History timeline this growth is observed through the year 2050 by when the global population is projected to surpass 9 billion. Because so many factors are at play in determining fertility rates, there are a range of potential outcomes for our projected global population. The United Nations developed a series of these projections for their report, World Population Prospects: 2017 Revision, based on possible changes to the global fertility rate, and provide estimates to the likelihood of three different scenarios unfolding.Even small differences in the global fertility rate will have a significant impact on the trajectory of our global population. As demographers gain more accurate data from country reports, the projections are adjusted. For example, the 2012 Revision's medium-variant projection had global population at an estimated 10.9 billion in 2100. The 2017 Revision has increased that medium-variant projection to 11.2 billion following the analysis of recent health and demographic surveys. Because of the volatility of future projections, the United Nations utilizes probabilistic statistics to set the range of possible population outcomes rather than one exact number. Within each of the population projections there is an expected decline in fertility rates, but to what extent is still up for debate, as is the anticipated peak of our total global population.
WOMEN'S STATUS AND FERTILITY RATES
The role and status of women around the world is very closely tied to fertility rates and ultimately, population growth trends. Universal education and gender equity are both very important topics to consider when discussing the link between fertility trends and women.
A TRADITION OF DISCRIMINATION
Progress toward gender equity is hampered by long-held traditions that define women's roles narrowly as childbearers and unpaid workers in the home and fields. This is especially true in many of the less developed countries, where the cycle of discrimination against women begins with the treatment of girls. Some societies limit girls' access to formal education, thereby limiting future employment and economic freedom. Girls' education often ends with an early marriage.
THE IMPORTANCE OF AN EDUCATION
Investments in women's education have proven especially effective at lowering fertility rates, since better educated women tend to marry later and have fewer, healthier children. Studies on every continent show that as literacy rates rise, especially those of women, income levels, nutrition levels, and child survival rates rise as well. A study using data from 219 countries from 1970 to 2009 found that, for every one additional year of education for women of reproductive age, child mortality decreased by 9.5 per cent.
PARTICIPATION IN THE ECONOMY
When more women work, economies grow. Increasing women and girls' education contributes to higher economic growth. But today, women still earn substantially less than men and bear a disproportionate responsibility for unpaid care work. When paid and unpaid work are combined, women in developing countries work more than men, with less time for education, leisure, political participation and self-care. Women make a significant contribution to agricultural work worldwide, yet fewer than 20 percent of landowners are women. This jeopardizes their long-term economic security.
GOVERNMENT PARTICIPATION
Women have historically had fewer opportunities in the policy-making bodies, and change has been slow. In 2015, women comprise just one-fifth of legislators worldwide and only 7 percent of heads of state. Some countries have only recently granted women the right to vote, including Saudi Arabia and the United Arab Emirates. When women have greater participation in policy-making, they can more effectively advocate for policies that advance women's status and child health, both essential for healthy, sustainable societies.
WOMEN'S HEALTH
One of the key U.N. Millennium Development Goals objectives was to achieve universal access to reproductive health and family planning services. Allowing families to plan the number and timing of their children reduces infant mortality rates and improves the health of both women, and their families. The very conditions that will help the population stabilize are also good for society; they help families' live longer, healthier lives, raise healthier children, and have more opportunity to contribute to their nations and families' prosperity. These kinds of advancements will lead to lower fertility rates, and eventually, population stabilization.
URBANIZATION AND THE MEGACITY
Across the globe and in a short amount of time, we've given up the tractor for the city bus, the open landscape for one of brick and mortar. We are now an urban planet. In fact, by 2008 over 50 percent of the global population was living in urban areas. It was 3 percent in 1800. Throughout history, cities have attracted people as centers of culture, religion, learning, and economics. Looking back, the first wave of urban migration took place in what are today's more developed countries, especially in Europe and North America. But looking ahead, 90 percent of the future urban increase is expected to take place in Asia and Africa, and it is projected that close to two-thirds of all people will be calling cities home by 2050.
Urbanization is often linked with economics - increased job opportunities, a centralized market, better pay and higher individual wealth have all drawn people into cities. And for a long time, these pull factors are what caused cities to grow. The Industrial Revolution caused a shift from agriculturally based societies to industrial, and thus geographically centered, societies. But that dynamic is changing. Today, most urban growth is natural increase - due to more births than deaths among those already dwelling in cities. Additionally, formerly small settlements are being reclassified as urban areas as the populace living there grows from within.
IMPLICATIONS OF GROWING "TOO FAST"
Depending on cities' ages and locations, there is much variation in wealth and infrastructure. Many of the newer urban areas, located in Latin America, Asia and Africa, have an entirely different look, feel, and outlook than their older European or North American counterparts. How fast an area grew, or is growing, is a key component.
When a city grows at a manageable rate, which is often considered roughly 1 percent annually, its infrastructure can keep pace with an increasing population and its demands. Necessities such as roads and public transportation, appropriate sewers and water treatment facilities, clinics, schools and housing have time to be planned and built alongside the increase in human numbers. The risk of fast urban growth, especially in an economically strained country, is that the necessary infrastructure often cannot expand fast enough to keep up with residents' needs. Without infrastructures in place to provide basic needs, residents can be forced to create their own provisions with whatever is available.
THE RISE OF SLUMS
In less developed countries, densely populated slums form both on the edges and within the largest cities. Due to a poor economy and weak infrastructure, cities such as Mumbai, India do not have the means to support the overwhelming urban population. According to the 2009 UN World Urbanization Prospects Report, Mumbai ranked as the fourth largest city in the world, with over 20 million people in the entire metropolitan area. Even more striking, over half of Mumbai's metro residents live in slums surrounding the city, causing huge public health, environmental, and land use problems.
Slum dwellers survive with practically no sanitation, water, urban amenities, employment, or security, and almost one-sixth of the world's population lives under these conditions. The lack of running water and sanitation, plus malnutrition and inadequate housing, leads to deadly conditions in the slums and shantytowns that surround many cities in Africa, Asia, and Latin America. The spread of HIV/AIDS and other infectious diseases in areas where so many people live in such close physical proximity is a critical public health issue for urban areas throughout the developing world. When combined with high unemployment rates and inadequate schools, these public health issues create a poor quality of life for many of the city's residents.
THE EMERGENCE OF MEGACITIES
The urban shift over time has led to the emergence of the megacity - a city with a population of 10 million or more. New York City and Tokyo were the first known megacities, both reaching an urban conglomeration of over 10 million by the 1950s. But today they are far from alone in their size. In 2014 there were 28 megacities across the planet - from Sao Paulo, Brazil to Lagos, Nigeria and London, England to Shanghai, China - and all major global regions except Oceania are marked with megacities. (See the Megacities overlay on the World Population Map).
Most of the cities that have reached the 10 million marker in recent years are located in Asia and Africa. In fact, it's where seven of the eight newest megacities can be found and where 10 of the 12 projected 2030 megacities will be located. These regions are also home to the fastest growing megacities. The population of Kinshasa, capital of the Democratic Republic of the Congo, has doubled roughly every 5 years since 1950. From 2010 to 2015, Kinshasa's population grew by over 23 percent, and today over half of the 11.6 million residents are under 22 years old. A combination of factors has led to this growth including migration from rural areas, high fertility rates, and widening of the city's boundaries. The population is outpacing almost all support structures in the city where the threat of food shortages, traffic congestion, and insufficient education facilities have become a stark reality.
ENVIRONMENTAL PROS AND CONS
A large urban population may seem environmentally troublesome with cities viewed as a disruption to the natural world. But environmentalism and urbanization are not incompatible. Dense urban areas have a much smaller ecological footprint - many people live in apartments or smaller connected houses rather than ranch-style homes in sprawling neighborhoods. Multifamily dwellings have the added benefit of being more energy efficient and they require less resources per person. Cities are also walkable and have public transportation options that can make cars less of a necessity. And above all, densely populated areas make it possible to protect other open spaces to serve as wildlife habitat, farmland, conservation areas, or oxygen-producing forests.
But of course, there are ecological downsides to cities as well. Concentrations of people mean concentrations of pollutants and trash. Cities produce up to 70 percent of global CO2 emissions and smog is becoming a common feature in many urban landscapes. Large swaths of continuous pavement prevent water drainage and boost temperatures. Without proper infrastructure, cities also risk having waste - both trash and human waste - clogging waterways and causing damage. And with cities across the globe producing 1.3 billion tons of waste annually, that's a lot for one area to handle.
PLANNING AN URBAN FUTURE
It is predicted that most future urban growth will happen in settlements currently home to between 100,000 and 250,00 people, and if this is to be done sustainably, planning is a must. Future high-growth areas require strategic urban planning individually tailored to a city's history, culture, value system, and other specificities; a single cookie-cutter approach won't work, nor will the plans of the 20th century. But by keeping an eye towards social justice concerns, natural resource use, environmental hazards, and other issues of modern cities, urban plans can help ensure the health and well-being of tomorrow's city dwellers.
July 29
In 2019, Earth Overshoot Day is on July 29. Earth Overshoot Day is calculated by Global Footprint Network and is a campaign supported by dozens of other nonprofit organizations. Information about Global Footprint Network's calculations and national Ecological Footprints are available online.
How long will Earth's resources last 2019 ?
Humans have exhausted all natural resources the planet can sustainably supply for 2019 faster than ever - overshooting by more than five months.Jul 29, 2019
How many planets worth of resources are we using ?
Every year we blow this ecological budget earlier and earlier and at our current rate of resource use we'd need 1.75 planets to support our demand on Earth's ecosystem.Jul 29, 2019
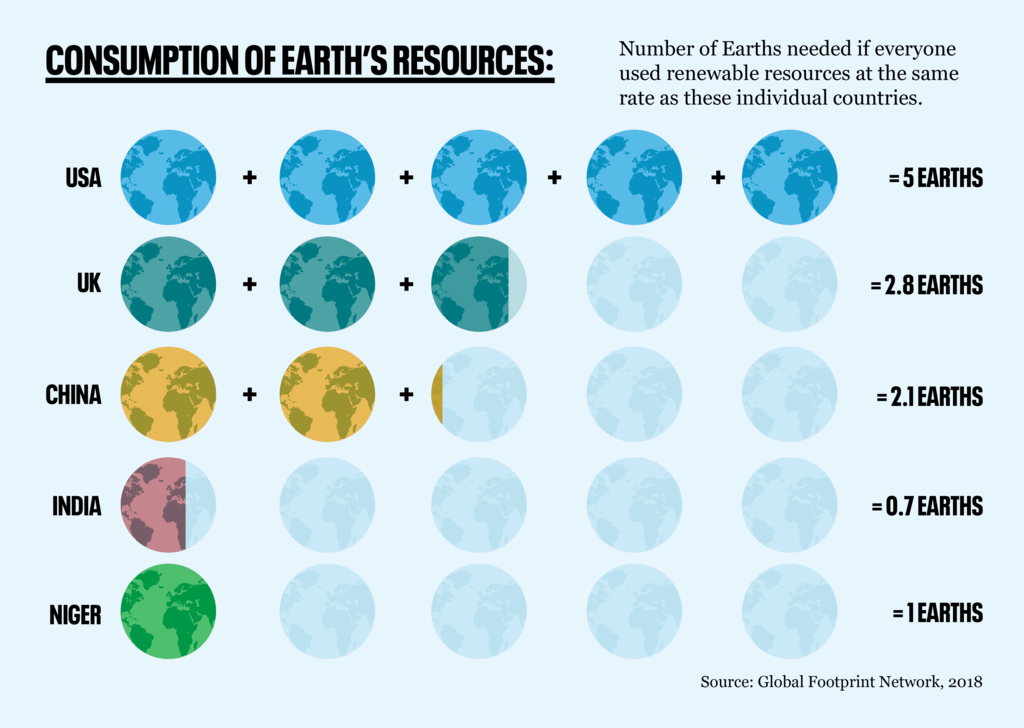
If everyone lived like Americans we would need 5 earths
Earth Overshoot Day marks the day when human's use of resources for that year reaches unsustainable levels. The use of resources after this a burden on the planet.
ENVIRONMENT Updated: Aug 02, 2017 11:09 IST
On August 2, humans used up all the resources that can be sustainably renewed by earth this year and whatever is consumed till the end of 2017 will count as a burden on the planet.The idea of Earth Overshoot Day is to have a threshold, beyond which we are overdrawing from our pool of replenishable resources of the planet
In 1997, Earth Overshoot Day fell in late September but over the years it has come earlier and earlier now falling in early August. Humans today need 1.7 earths to satisfy their needs and wants now, and at the pace of consumption we would need 2 earths by 2030.
However, if people across the world lived like Indians we would require only 0.6 earths, which means using less than what is available for exploitation. ?If everyone on the planet lives like Americans, we would need 5 earths, according to Global Footprint Network.
Excessive use of resources has real consequences for the planet. A WWF report showed that there was a 58% fall in global populations, fish, birds, mammals, amphibians and reptiles between 1970 and 2012, indicating that human pressure on natural resources in unsustainable, eating into the resources available for other species.
In India, one of the ways this stress on the environment is manifesting is as a water crisis. Of the 20 major river basins in the country 14 are water stressed and there is likely to be acute water scarcity in the country by 2050. An overwhelming proportion of surface water sources (70%) are polluted and 70% of groundwater resources will become critical within the next 10 years.
"Economic growth and development is critical for India - improved education, health, and job opportunities along with better infrastructure are much needed," Sejal Worah, Programme Director, WWF-India. "However, if not properly planned and implemented, such growth can also pose a significant challenge to the natural environment. The message from our planet is clear and one we cannot ignore.
Experts say that humans can still redeem what is left of earth's resources if they can push the limit further by 4.5 days every year, which would mean using fewer and fewer resources.?If humans tread this path there is hope that by 2050 we would be using resources sustainably again.
President Trump has acted on his campaign promises to reverse Obama's environmental policies and proposed a budget that would significantly slash the Environmental Protection Agency's funding in an effort to take federal responsibility out of environmental regulations. More recently, White House officials have met to discuss whether the United States should leave the Paris climate agreement.
The United States is one of the world's biggest consumers, and U.S. policies can have global environmental effects. As of 2013, the world's population would need 1.7 Earths to support its demands on renewable natural resources, according Global Footprint Network, a nonprofit organization that calculates human demands on the planet's ecosystems.
We would need 1.7 Earths to make our consumption sustainable
Global Footprint Network measures human consumption relative to what
the planet can regenerate with a measure called the ecological footprint.
The footprint takes into account how much in biological resources, such as
fishing grounds and forest land, are necessary to fulfill the consumption of a
country and absorb its waste. This includes imports and excludes exports. The smaller a country's
footprint is, the better.
A country also has a biocapacity that is, the country's capacity to renew the resources demanded from its ecosystems. Because this measure is based on technology and land-management practices, biocapacity may change from year to year. The bigger a country's biocapacity is, the better.
Therefore, a country has an ecological deficit if its ecological footprint is greater than its biocapacity and ecological reserve if its biocapacity is greater.
[Scientists are looking at these indicators to measure climate change]
How we got here
Of the countries running the highest ecological deficits, the United States has one of the highest biocapacities. This means that even though the country has a lot of resources, its consumption is still highly unsustainable.
Since 2005, however, the United States has been decreasing its ecological footprint. Its fossil fuel use is the largest component of the nation's ecological footprint. In 2013, the country's carbon footprint per capita reached its lowest since 1980. This may be the result, in part, of a smaller role that coal plays in the U.S. economy.
[Appalachia comes up small in era of giant coal mines]
Within the United States, Virginia has the biggest ecological footprint per capita, nearly twice that of New York. According to a report from Global Footprint Network, this is partly because of the greater density of New York, which allows for more efficient use of infrastructure, such as public transportation. Virginia also has a larger housing and personal transportation footprint per capita.
Of the countries with the largest ecological reserves, most have bio-capacities that are declining at a sharp rate. In other words, they may run into ecological deficits soon if the trend continues. In some countries, this can be attributed to a combination of rapid population growth and deforestation.
The United States makes up 13 percent of the world's total footprint and has the second-largest deficit in the world, trailing China's deficit, which is driven by its accelerated growth. While the United States' total footprint has been decreasing since 2005, it is still twice the size of India's and far greater than that of other developed countries.
Which countries are developing sustainably ?
Economic development often means using more resources and increasing carbon emissions. From 2000 to 2013, most countries increased their GDP and ecological footprints at the same time. However, there are 48 countries that managed to develop sustainably: They increased GDP while decreasing their ecological footprints, though most of these countries saw small economic growth.
For developing countries, an increase in ecological footprint may be necessary to bolster their economies. Footprints per capita in these countries may not be high to begin with, so small changes can cause a comparatively big jump. Sustainable technology may also not be as widely available in developing countries.
For developed countries, the opposite may be true: Because their rate of growth is decreasing and most already have large footprints, fluctuations might not be so obvious.
Though there are many solutions, the fastest way for a country to reduce its ecological footprint, according to Global Footprint Network, is to switch to greener energy sources. Even though the United States has been decreasing its ecological footprint, its consumption rate is still far from completely sustainable.
https://www.footprintcalculator.org/
Now 1.7 and 3 Earths - Global Footprint Network
Consumption of Earths Resources
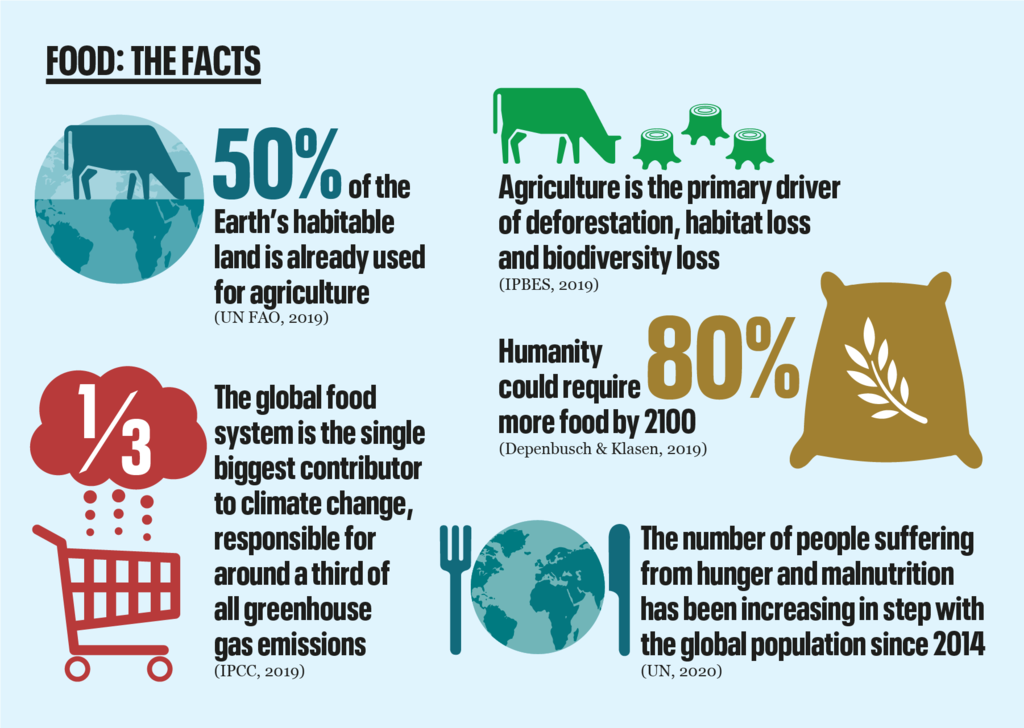
Food Consumption Impact
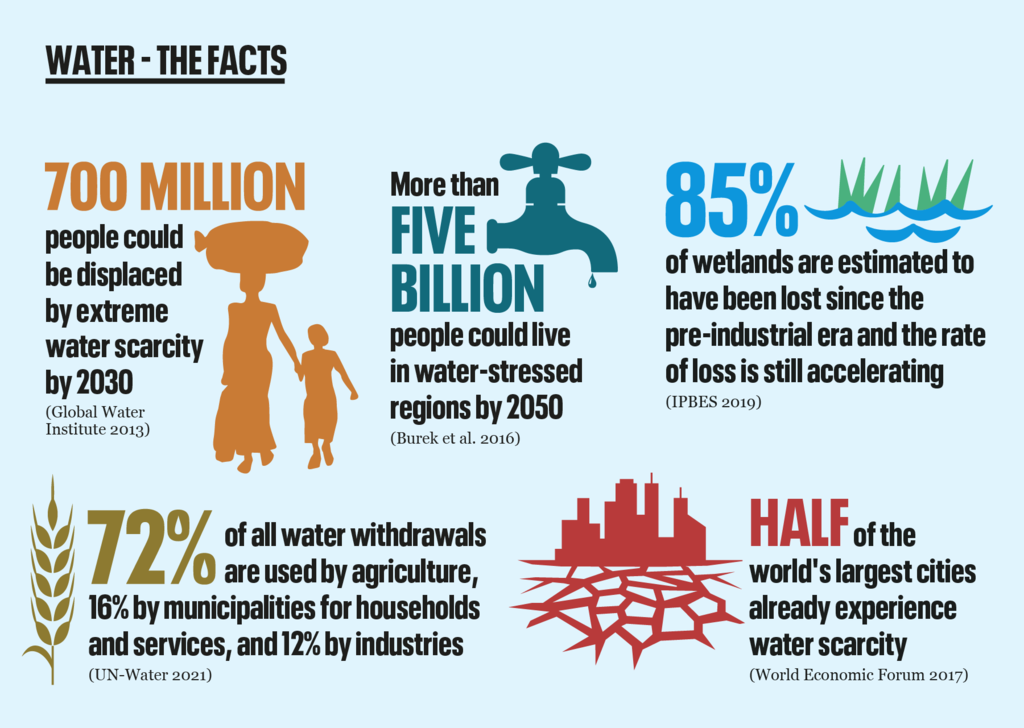
Water Shortages Impact
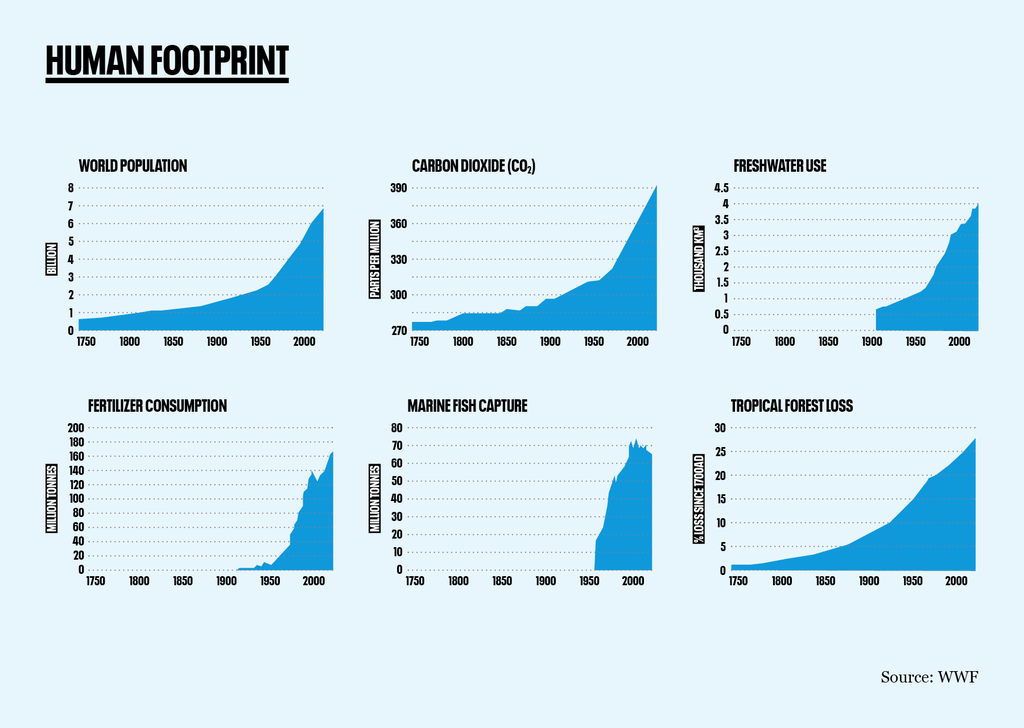
Enviromental Indicators Vs Population - WWF